...
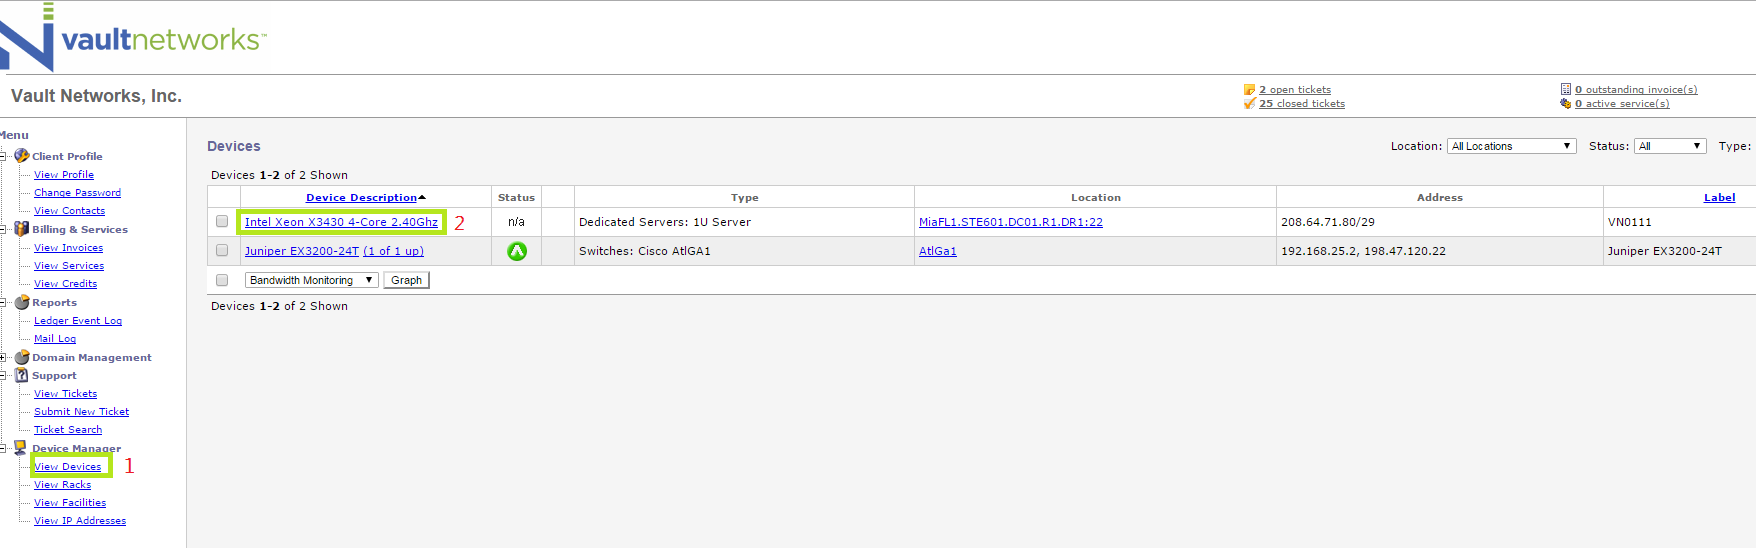
- Click "View Devices"
- Click on the Device that you wish to view. In this scenario we will click on "Intel Xeon X3430 4-Core 2.40Ghz"
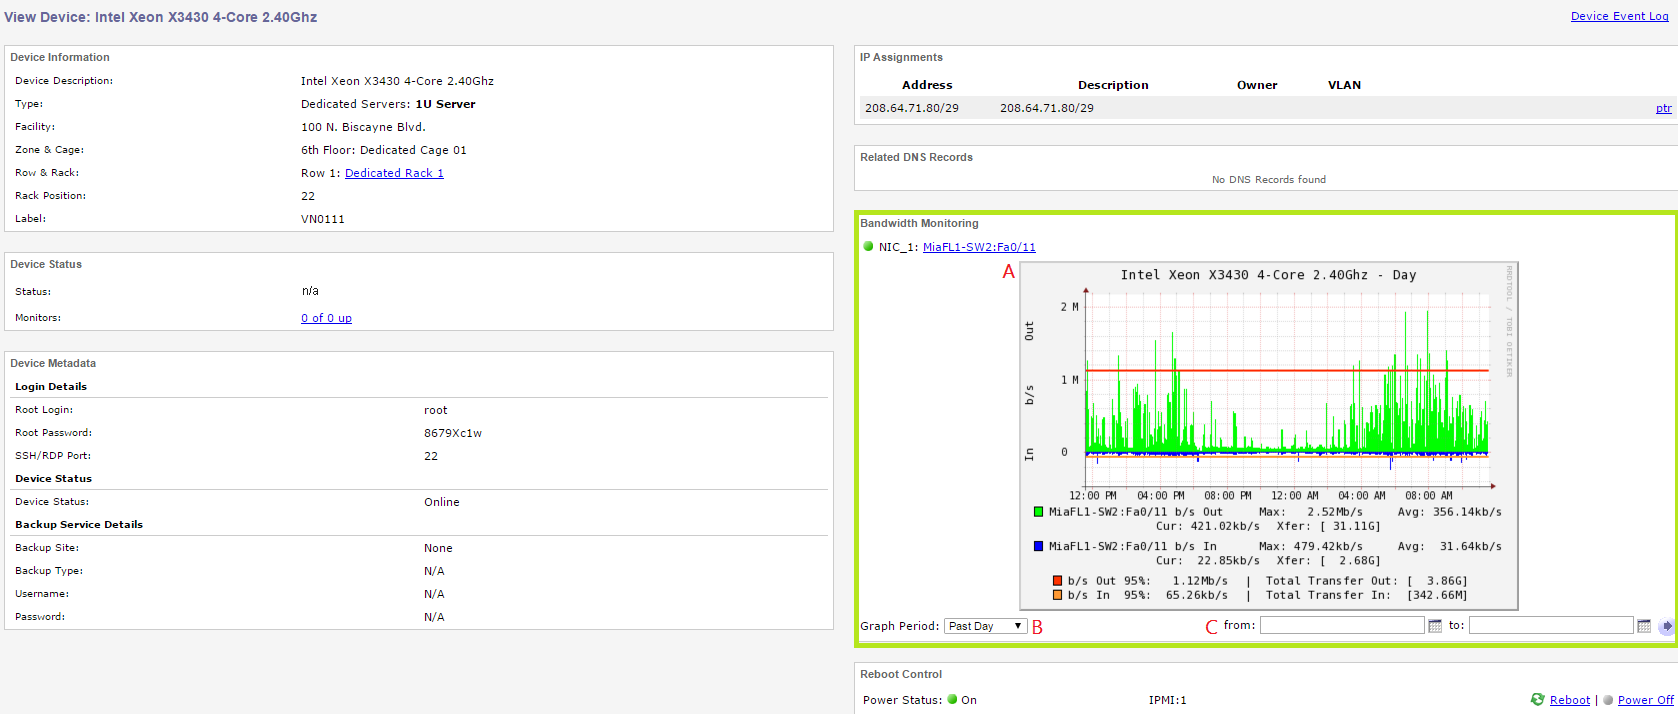
- On the next page, there will be a table labeled "Bandwidth Monitoring". All information regarding Bandwidth usage is available here, including the following:
- Bandwidth Graph - This is where Bandwidth information will be displayed
- Graph Period - This dropdown list will show the current timeframe viewed in the chart. You can quick-select common views such as "Past Day" by selecting them in the drop down.
- From - If you wish to view a specific set of dates, you can enter those date manually here to display the desired time frame in the chart